
Heartaches by the Numbers, Demos by the Score: The Environmental Impact of Demolition Debris
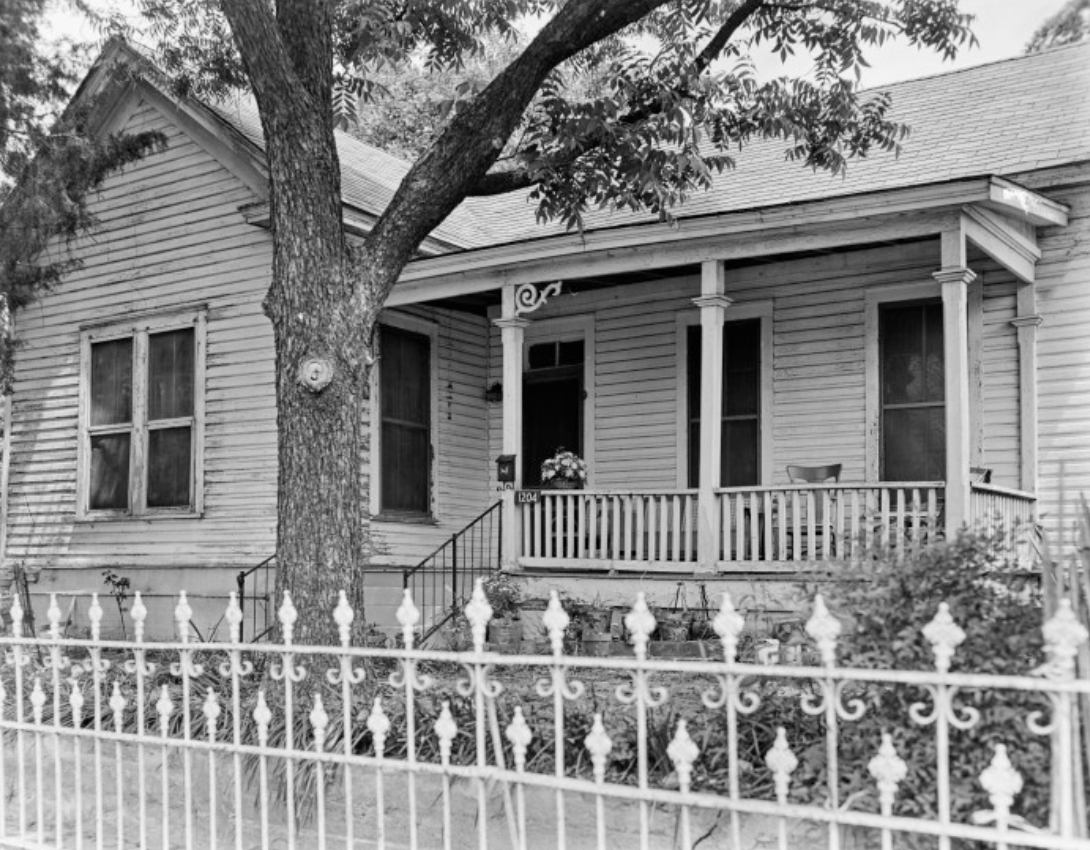
Zakrison-Sandoval House, 1204 E. 6th Street (ca. 1885), demolished fall 2021 (Texas Historical Commission via Portal to Texas History)
BY MARY KAHLE, PRESERVATION AUSTIN POLICY INTERN, SPRING 2022
You know the feeling. You’re driving along, thinking about nothing in particular, when you suddenly realize there’s a shiny tower or sleek modern house where a little cottage stood just a few weeks before. That’s the reality in the Austin of today, where a vibrant economy and the supercharged real estate market have led to dramatic changes in neighborhoods and unprecedented challenges in the housing market, including affordability, displacement, and gentrification.
In addition to these issues is the environmental impact of all this demolition and construction, a facet of the conversation that bears on decisions around historic preservation, especially given Austin’s legacy as a green building pioneer. Understanding this part of the equation is crucial to making thoughtful decisions as we navigate these pressures and develop forward-thinking strategies to preserve our historic fabric.
What are the numbers?

Figure 1. Top ten zip codes for final residential demolitions, 2010-2021
First, what exactly is the scope of residential demolition in Austin, and where is it taking place? A deep dive of construction permits issued by the City of Austin reveals the dramatic increase in the pace of residential demolitions in just over the last decade. Between 2010 and the end of 2021, finalized residential demolitions per year rose from 271 to 622, an increase of 130%.
While it’s apparent on an observational level that certain parts of town are bearing the brunt of demolition, seeing the numbers clarifies the issue. Of the total 6,172 residential demolitions that occurred from 2010 through 2021, four zip codes accounted for 56%, and 78704 alone accounted for 21% (Figure 1).
Looking at it through the lens of Austin City Council districts, three districts accounted for over 50% of the total number of demolitions, and the top six districts accounted for over 90%. (Figure 2.) In just 2021, those six districts accounted for 91% despite some minor shifts in ranking.

Figure 2. Council district rankings for final residential demolitions, 2010-2021
Single-family buildings accounted for nearly 68% of these residential demolitions, multi-family (greater than two-family) buildings accounted for nearly 30%, and two-family buildings accounted for the remaining 2.5%.
What does this mean? The highest percentages occur in or near the city’s core - no great surprise there. The map of city council districts shows that the top six districts for demolition hew to the I-35 corridor with the exception of District 10. They are also the city’s oldest and often minority neighborhoods, comprising historic properties - as noted, mostly single-family homes - ranging in age from the late 1800s through the 1970s. (A standard within historic preservation is that a property must be at least fifty years old to qualify for historic designation, with some exceptions.)
According to rough figures from the city’s permits database, the largest percentages include buildings dating from the 1930s through the 1950s, although significant numbers on both ends of that range have been demolished. Austin’s core is being pummeled, or, as a member of Austin’s Historic Landmark Commission recently remarked, “This is carnage, guys.”
The Environmental Fallout
The environmental effects of demolition are clear. According to the San Antonio report Treasure in the Walls, “in the U.S., construction and demolition (C&D) debris accounts for approximately 30% of all solid waste produced. Just in 2018, C&D debris accounted for more than twice the amount of municipal solid waste in the U.S. … A large majority of this debris ends up in landfills, which have detrimental effects on the environment and community health.”

Figure 3. Council district rankings for final residential demolitions, 2021
According to the Texas Commission on Environmental Quality report for 2020, the overall figure for Texas is 21%. In Travis County it is approximately 25% based on 2020 figures from the county’s three municipal solid waste (MSW) landfills, all three of which are located east of I-35. Obtaining the breakdown between residential and commercial work is extremely difficult, compounded by the fact that Travis County’s landfills accept debris from multiple counties, but these figures offer a starting place for discussion.
Tonnage figures for demolitions across the U.S. (buildings, road and bridges, and other structures) are also revealing. “In 2018 in the U.S., 600 million tons of C&D debris were generated … C&D concrete was the largest portion at 67.5 percent, followed by asphalt concrete at 17.8 percent. C&D wood products made up 6.8 percent, and the other products [shingles, brick and clay tile, drywall and plasters, and steel) accounted for 7.9 percent combined … Demolition represented over 90 percent of total C&D debris generation.
In Travis County in 2020, total C&D demolition was over 655,000 tons, although, again, the residential/commercial breakdown is unclear. At the city level, the total square footage of final demolitions from 2010 through 2021 was 4,959,157 S.F.

McPhail’s Florist, 605 Barton Springs Road (ca. 1928), demolished 2021 (Joe M. O’Connell)
Other Environmental Impacts
There are additional environmental downsides to demolition. The San Antonio report raises the issue of embodied energy, which the EPA defines as “‘the amount of energy consumed to produce … building materials. This includes the energy needed to mine or harvest natural resources and raw materials, and manufacture and transport finished materials.’” The report notes that “there is approximately 41.3 tons of embodied energy in a 1,500 square foot house that is lost when it is razed.”
This is equivalent to, among other things, 8.1 passenger vehicles driven for a year, 4,216 gallons of gasoline consumed, or 41,283 pounds of coal burned. Multiply that 41.3 tons by Austin’s 6,172 residential demolitions from 2010 through 2021, and we see that Austin lost approximately 255,000 tons of embodied energy during that period.
Another facet of the environmental impact from demolitions involves the mitigation of hazardous particles that disperse during the mechanical pulverization of materials. Best practices dictate hosing the site during demolition and properly disposing of runoff, but hazardous materials may leach into the soil regardless of these measures. In addition, if these practices are not adequately followed, workers and the surrounding neighborhoods are exposed to crystalline silica dust and other hazardous materials.
Solutions

Utility Home in Air-Conditioned Village, 2602 Park View Drive (1955), demolished ca. 2012 (Dewey G. Mears).
Given these factors, the need to reduce demolition debris is clear. The City of Austin has a recycling ordinance to divert C&D debris from landfills, but it only applies to construction projects over 5,000 S.F. and commercial and multi-family demolitions. It does not include single-family residential demolitions, which comprised nearly 68% of Austin’s residential demolitions over the past decade.
That said, City of Austin staff concluded in an economic impact study that the projects covered under the ordinance are achieving “strong diversion rates,” although improved metrics are needed to fully evaluate its success. The report also concluded that Austin has a market for materials reused through deconstruction - “the process of dismantling structures component by component in order to harvest materials to be salvaged” - but further expansion may be limited by the dearth of reuse outlets, added labor requirements, the usability of fixtures, and other factors. However, two important local players in this market are making a difference: Deconstruct Austin, the local affiliate of the non-profit The ReUse People of America, and the Austin Habitat for Humanity Re-Store.
San Antonio’s Roadmap

Liberty Lunch, 405 W. 2nd St., demolished in 1999 (Austin History Center via Portal to Texas History)
What have other cities done? San Antonio, which is facing affordability and environmental problems similar to ours, recently developed a roadmap for a deconstruction policy that would transition the city “from a linear economy model, whereby materials are manufactured, used, and discarded, to a circular economy, where rather than discarded, materials are recycled and reused.”
The report highlights the upsides to deconstruction, such as the rapid growth of the material reuse industry, the number of jobs produced relative to the number produced by demolition (300 jobs per 10,000 tons of waste compared to 1-6), total labor income four times greater than that produced through demolition, and reduction of the health hazards created during mechanical demolition.
The San Antonio report recommends the adoption of a deconstruction ordinance, a pilot project based on city-ordered demolitions, incentives such as a micro-grant program and expedited permit review, the development of a salvage-to-ADU program tied to a review of building codes and affordable housing strategies, the establishment of workforce development programs, and a city facility to serve as a City-incubated Reuse Warehouse. (Read more on San Antonio’s deconstruction policy in the news)
Portland’s Leadership

3015 Fontana (ca. 1956), demolished ca. 2020 (Photo: Claire Closmann)
Portland, Oregon, is also a leader in deconstruction initiatives, having recently adopted an ordinance that applies to “all single-dwelling structures (houses and duplexes) in all zones if the structure was built in 1940 or earlier, or the structure is designated as a historic resource subject to … demolition review or [other] delay provisions.” Further, the ordinance requires that a Certified Deconstruction Contractor must perform the work, and the demolition (deconstruction) permit will only be issued after the contractor submits a Pre-Deconstruction form to which only certified contractors have access.
Portland officials are optimistic that the program will divert 4,000 tons of materials annually, create job opportunities, mitigate the impacts of hazardous materials, and train “the next generation of deconstruction experts.” Said then Portland Mayor Charlie Hales, “‘“Our existing older houses are assets: They preserve our built history and contribute to neighborhood character … If they must come down, materials from these houses can live on in new buildings. By keeping valuable materials out of the landfill, we ensure the least amount of impact on the environment and neighbors. Deconstruction reduces our carbon footprint; prevents harmful air pollution caused by demolition; and creates good, family wage jobs.’”
Other cities across the U.S. are beginning to implement similar initiatives to address the coexisting issues of environmental stewardship, economic vitality, housing affordability, and historic preservation. In Austin, our historic fabric is rapidly losing ground, and finding strategies to address the environmental impacts of this constant churn will both save that fabric and protect public health for future generations.
Mary Kahle is Preservation Austin’s Spring 2022 Policy Intern. She is a graduate student in Public History at Texas State University.